Chapter 5: Gases and Introduction to Gas Laws
5.2. Relationship of Pressure, Volume, Amount, and Temperature
Learning Objectives
By the end of this section, you will be able to:
- Identify the mathematical relationships between the various properties of gases
During the seventeenth and especially eighteenth centuries, driven both by a desire to understand nature and a quest to make balloons in which they could fly (Figure 5.2.1 ), a number of scientists established the relationships between the macroscopic physical properties of gases, that is, pressure, volume, temperature, and amount of gas.

Pressure and Temperature: Amontons’s Law
Imagine filling a rigid container attached to a pressure gauge with gas and then sealing the container so that no gas may escape. If the container is cooled, the gas inside likewise gets colder and its pressure is observed to decrease. Since the container is rigid and tightly sealed, both the volume and number of moles of gas remain constant. If we heat the sphere, the gas inside gets hotter (Figure 5.2.2) and the pressure increases.
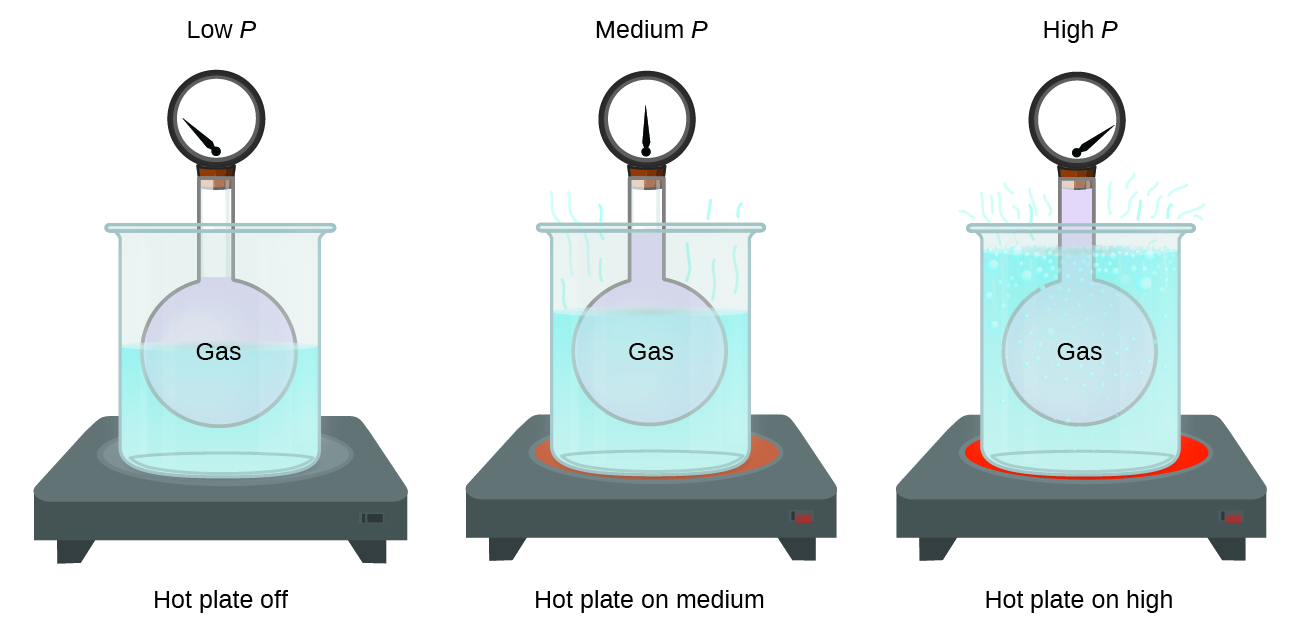
Guillaume Amontons was the first to empirically establish the relationship between the pressure and the temperature of a gas (~1700), and Joseph Louis Gay-Lussac determined the relationship more precisely (~1800). Because of this, the P–T relationship for gases is known as either Amontons’s law or Gay-Lussac’s law. Under either name, it states that the pressure of a given amount of gas is directly proportional to its temperature on the kelvin scale when the volume is held constant. Mathematically, this can be written:
where ∝ means “is proportional to”.
Volume and Temperature: Charles’s Law
If we fill a balloon with air and seal it, the balloon contains a specific amount of air at atmospheric pressure, let’s say 1 atm. If we put the balloon in a refrigerator, the gas inside gets cold and the balloon shrinks (although both the amount of gas and its pressure remain constant). If we make the balloon very cold, it will shrink a great deal, and it expands again when it warms up.
Link to learning
These examples of the effect of temperature on the volume of a given amount of a confined gas at constant pressure are true in general: The volume increases as the temperature increases, and decreases as the temperature decreases.
Volume and Pressure: Boyle’s Law
If we partially fill an airtight syringe with air, the syringe contains a specific amount of air at constant temperature, say 25 °C. If we slowly push in the plunger while keeping temperature constant, the gas in the syringe is compressed into a smaller volume and its pressure increases; if we pull out the plunger, the volume increases and the pressure decreases. This example of the effect of volume on the pressure of a given amount of a confined gas is true in general. Decreasing the volume of a contained gas will increase its pressure, and increasing its volume will decrease its pressure. In fact, if the volume increases by a certain factor, the pressure decreases by the same factor, and vice versa. Volume-pressure data for an air sample at room temperature are graphed in (Figure 5.2.3.).
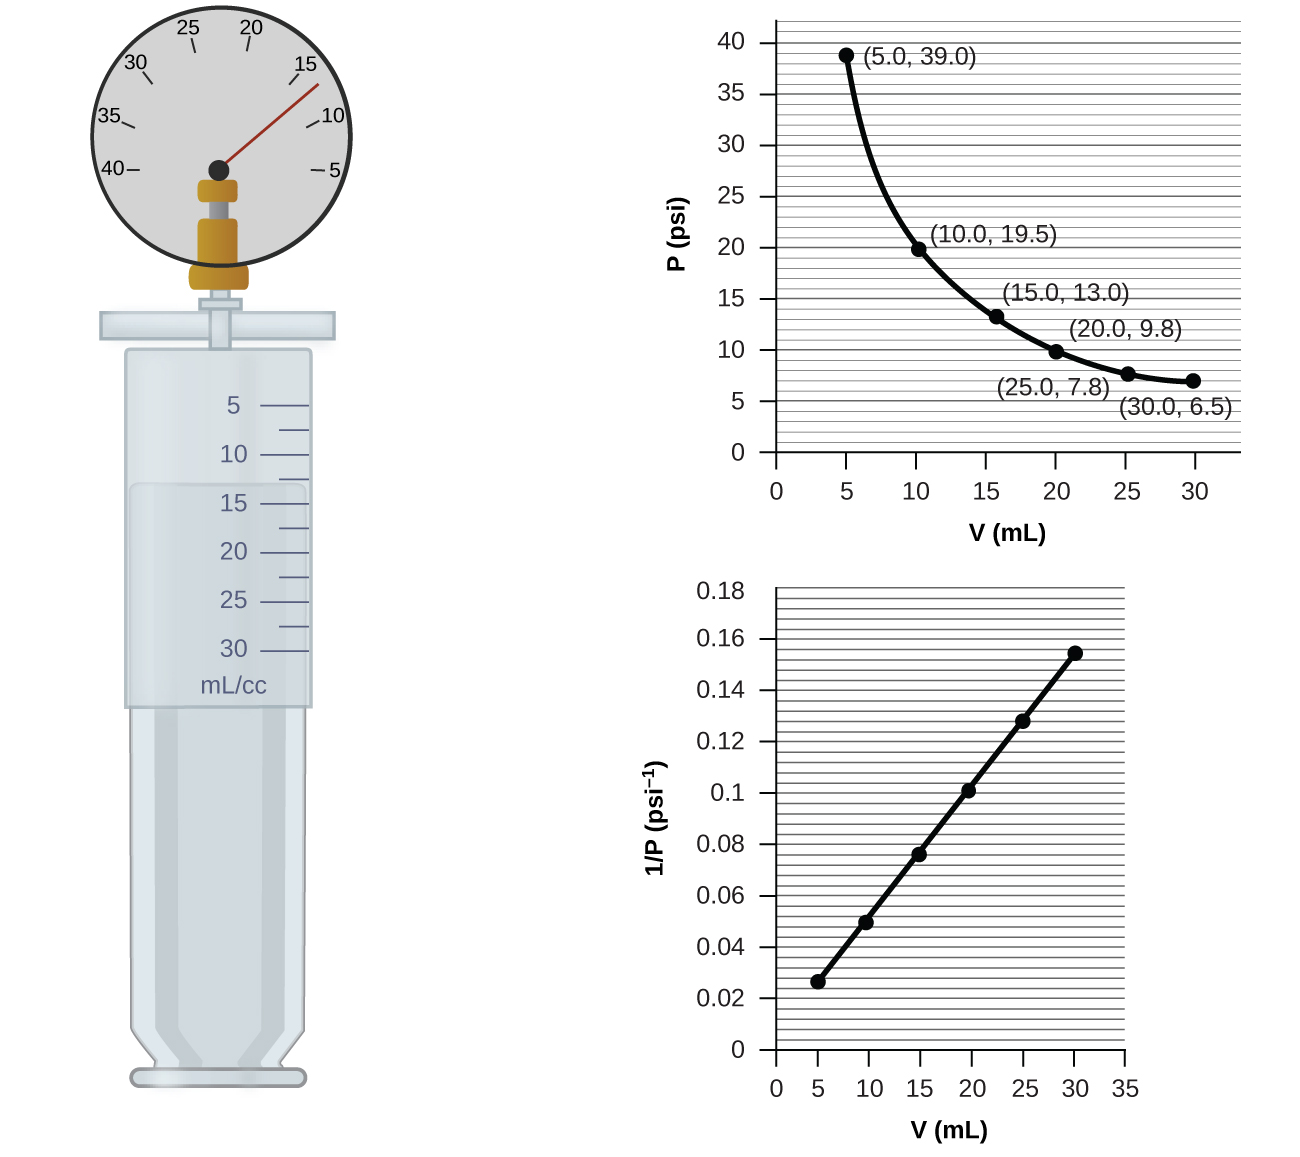
Unlike the P–T and V–T relationships, pressure and volume are not directly proportional to each other. Instead, P and V exhibit inverse proportionality: Increasing the pressure results in a decrease of the volume of the gas. Mathematically this can be written:
The relationship between the volume and pressure of a given amount of gas at constant temperature was first published by the English natural philosopher Robert Boyle over 300 years ago. It is summarized in the statement now known as Boyle’s law: The volume of a given amount of gas held at constant temperature is inversely proportional to the pressure under which it is measured.
Example
A sample of gas has a volume of 15.0 mL at a pressure of 13.0 psi. Determine the pressure of the gas at a volume of 7.5 mL.
Solution
From Boyle’s law, we know that the product of pressure and volume (PV) for a given sample of gas at a constant temperature is always equal to the same value. Therefore we have P1V1 = k and P2V2 = k which means that P1V1 = P2V2.
Using P1 and V1 as the known values 13.0 psi and 15.0 mL, P2 as the pressure at which the volume is unknown, and V2 as the unknown volume, we have:
Solving:
Breathing and Boyle’s Law
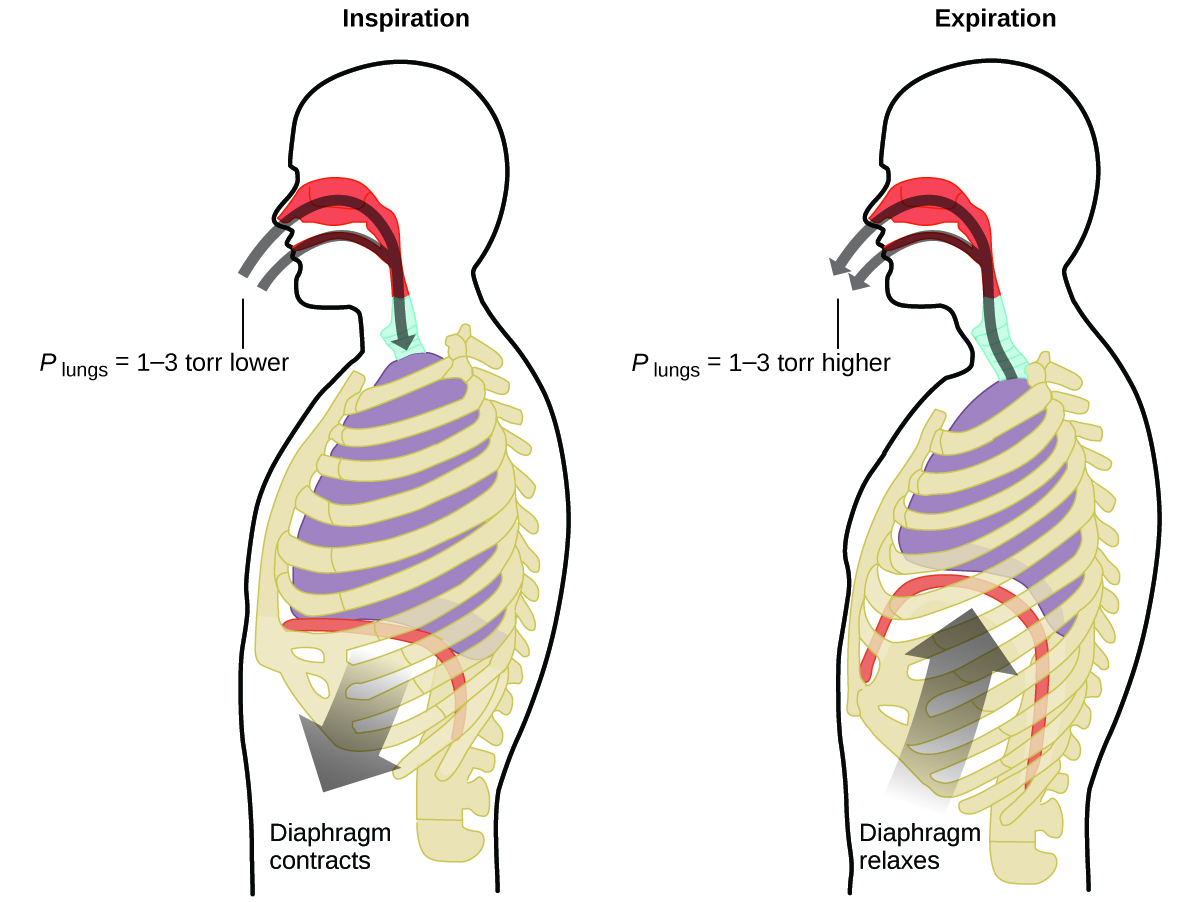
What do you do about 20 times per minute for your whole life, without break, and often without even being aware of it? The answer, of course, is respiration, or breathing. How does it work? It turns out that the gas laws apply here. Your lungs take in gas that your body needs (oxygen) and get rid of waste gas (carbon dioxide). Lungs are made of spongy, stretchy tissue that expands and contracts while you breathe. When you inhale, your diaphragm and intercostal muscles (the muscles between your ribs) contract, expanding your chest cavity and making your lung volume larger. The increase in volume leads to a decrease in pressure (Boyle’s law). This causes air to flow into the lungs (from high pressure to low pressure). When you exhale, the process reverses: Your diaphragm and rib muscles relax, your chest cavity contracts, and your lung volume decreases, causing the pressure to increase (Boyle’s law again), and air flows out of the lungs (from high pressure to low pressure). You then breathe in and out again, and again, repeating this Boyle’s law cycle for the rest of your life (Figure 5.2.4).
Example in everyday life
The Interdependence between Ocean Depth and Pressure in Scuba Diving
Whether scuba diving at the Great Barrier Reef in Australia (shown in Figure 5.2.5) or in the Caribbean, divers must understand how pressure affects a number of issues related to their comfort and safety.

Pressure increases with ocean depth, and the pressure changes most rapidly as divers reach the surface. The pressure a diver experiences is the sum of all pressures above the diver (from the water and the air). Most pressure measurements are given in units of atmospheres, expressed as “atmospheres absolute” or ATA in the diving community: Every 33 feet of salt water represents 1 ATA of pressure in addition to 1 ATA of pressure from the atmosphere at sea level. As a diver descends, the increase in pressure causes the body’s air pockets in the ears and lungs to compress; on the ascent, the decrease in pressure causes these air pockets to expand, potentially rupturing eardrums or bursting the lungs. Divers must therefore undergo equalization by adding air to body airspaces on the descent by breathing normally and adding air to the mask by breathing out of the nose or adding air to the ears and sinuses by equalization techniques; the corollary is also true on ascent, divers must release air from the body to maintain equalization. Buoyancy, or the ability to control whether a diver sinks or floats, is controlled by the buoyancy compensator (BCD). If a diver is ascending, the air in his BCD expands because of lower pressure according to Boyle’s law (decreasing the pressure of gases increases the volume). The expanding air increases the buoyancy of the diver, and she or he begins to ascend. The diver must vent air from the BCD or risk an uncontrolled ascent that could rupture the lungs. In descending, the increased pressure causes the air in the BCD to compress and the diver sinks much more quickly; the diver must add air to the BCD or risk an uncontrolled descent, facing much higher pressures near the ocean floor. The pressure also impacts how long a diver can stay underwater before ascending. The deeper a diver dives, the more compressed the air that is breathed because of increased pressure: If a diver dives 33 feet, the pressure is 2 ATA and the air would be compressed to one-half of its original volume. The diver uses up available air twice as fast as at the surface.
The Pressure of a Mixture of Gases: Dalton’s Law
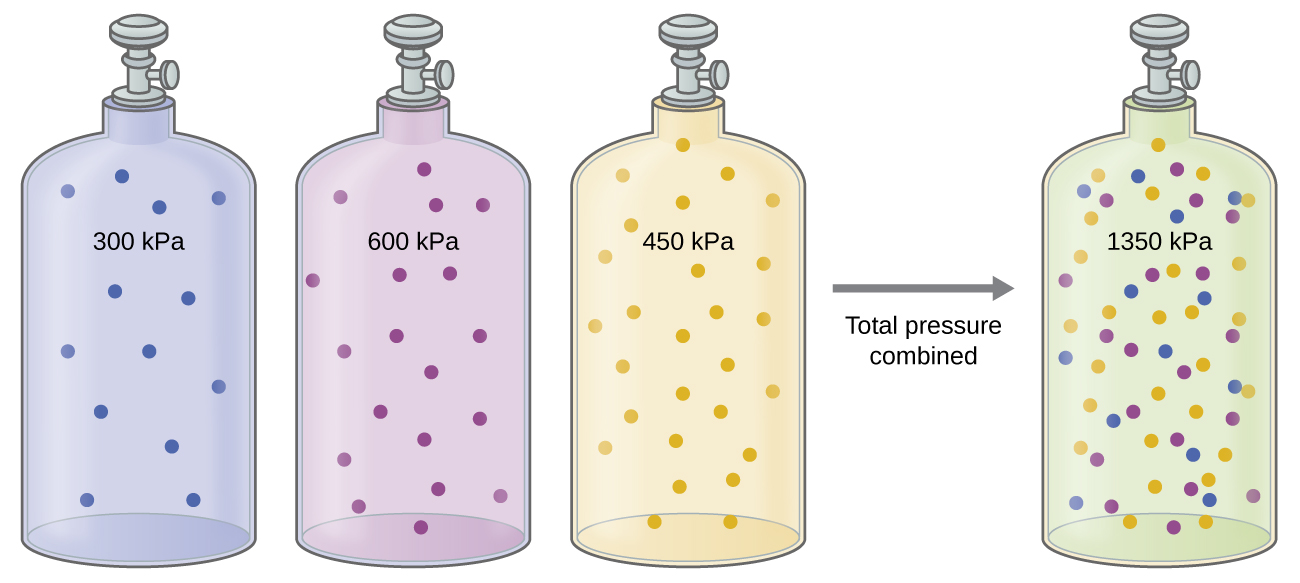
Unless they chemically react with each other, the individual gases in a mixture of gases do not affect each other’s pressure. Each individual gas in a mixture exerts the same pressure that it would exert if it were present alone in the container (Figure 5.2.6.). The pressure exerted by each individual gas in a mixture is called its partial pressure. This observation is summarized by Dalton’s law of partial pressures: The total pressure of a mixture of ideal gases is equal to the sum of the partial pressures of the component gases:
In the equation PTotal is the total pressure of a mixture of gases, PA is the partial pressure of gas A; PB is the partial pressure of gas B; PC is the partial pressure of gas C; and so on.
Here is an example of this concept, but dealing with fraction calculations.
The Pressure of a Mixture of Gases A gas mixture used for anesthesia contains 2.83 mol oxygen, O2, and 8.41 mol nitrous oxide, N2O. The total pressure of the mixture is 192 kPa.
(a) What are the mole fractions (proportion) of O2 and N2O?
(b) What are the partial pressures of O2 and N2O?
Solution
Given that mole fraction is:
and the partial pressure is PA = XA
PTotal.
For O2,
and
For N2O,
and
Key Concepts and Summary
Recalling that gas pressure is exerted by rapidly moving gas molecules and depends directly on the number of molecules hitting a unit area of the wall per unit of time, we see that the KMT conceptually explains the behavior of a gas as follows:
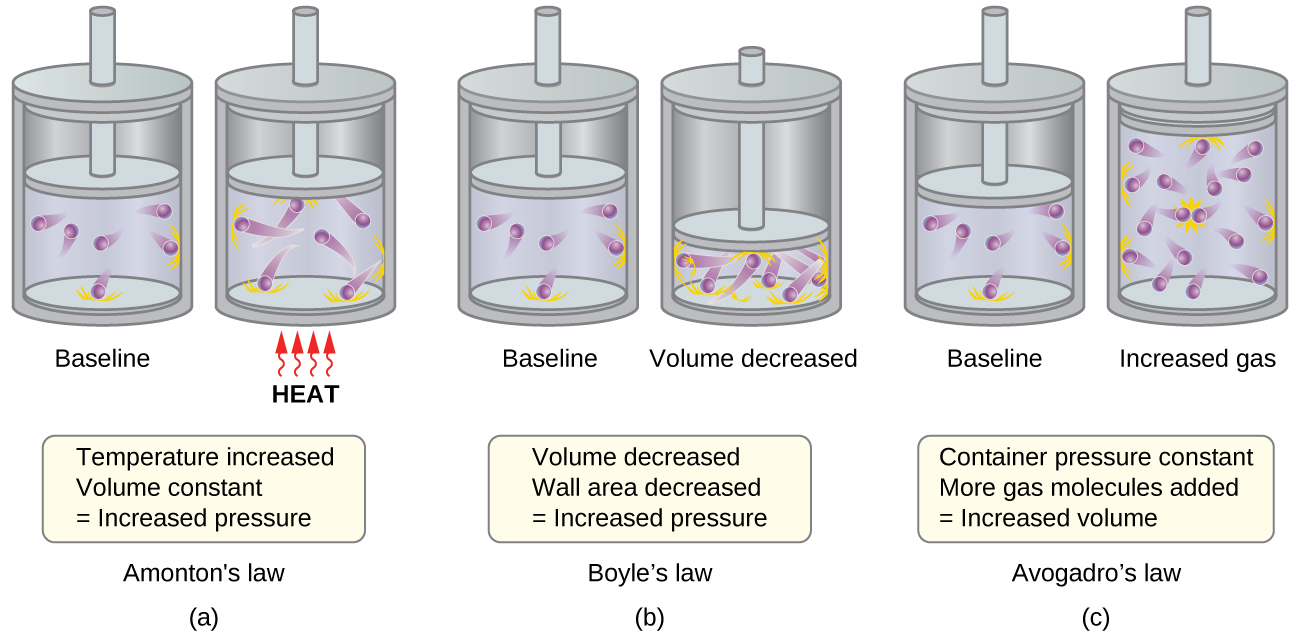
- Amontons’s law. If the temperature is increased, the average speed and kinetic energy of the gas molecules increase. If the volume is held constant, the increased speed of the gas molecules results in more frequent and more forceful collisions with the walls of the container, therefore increasing the pressure (Figure 5.2.7.(a)).
- Charles’s law. If the temperature of a gas is increased, a constant pressure may be maintained only if the volume occupied by the gas increases. This will result in greater average distances traveled by the molecules to reach the container walls, as well as increased wall surface area. These conditions will decrease the both the frequency of molecule-wall collisions and the number of collisions per unit area, the combined effects of which balance the effect of increased collision forces due to the greater kinetic energy at the higher temperature.
- Boyle’s law. If the gas volume is decreased, the container wall area decreases and the molecule-wall collision frequency increases, both of which increase the pressure exerted by the gas (Figure 5.2.7.(b)).
- Avogadro’s law. At constant pressure and temperature, the frequency and force of molecule-wall collisions are constant. Under such conditions, increasing the number of gaseous molecules will require a proportional increase in the container volume in order to yield a decrease in the number of collisions per unit area to compensate for the increased frequency of collisions (Figure 5.2.7(c)).
- Dalton’s Law. Because of the large distances between them, the molecules of one gas in a mixture bombard the container walls with the same frequency whether other gases are present or not, and the total pressure of a gas mixture equals the sum of the (partial) pressures of the individual gases.
Key Equations
- P ∝ T
- P ∝ 1/V
- P1V1 = P2V2
- PTotal = PA + PB + PC + …
Glossary
Amontons’s law: (also, Gay-Lussac’s law) pressure of a given number of moles of gas is directly proportional to its kelvin temperature when the volume is held constant
Boyle’s law: volume of a given number of moles of gas held at constant temperature is inversely proportional to the pressure under which it is measured
Charles’s law: volume of a given number of moles of gas is directly proportional to its kelvin temperature when the pressure is held constant
Dalton’s law of partial pressures: total pressure of a mixture of ideal gases is equal to the sum of the partial pressures of the component gases
partial pressure: pressure exerted by an individual gas in a mixture
License and attributions:
- Chemistry: Atoms first, Second edition, 2019, Flowers, P. et al. License: CC BY 4.0. Located at https://openstax.org/books/chemistry-atoms-first-2e/pages/8-2-relating-pressure-volume-amount-and-temperature-the-ideal-gas-law
